The software and Internet services sector has the costliest finance function at all levels of company revenue, spending at least twice what companies in the food and beverage sector do at equivalent revenue points, according to Gartner.
As many finance functions start to think about budgeting for next year and beyond, a Gartner analysis of finance function spend across industries and revenue levels conducted through April 2022 shows some clear differences in the amount of finance spending by different industries and how that spending scales.
“With 80% of finance function costs coming from personnel costs, chief financial officers (CFOs) are certainly not immune to the effects of inflation,” says Matt Williams, director: research, in the Gartner Finance practice. “CFOs are going to have to scrutinise their decisions on cuts and investments within their own teams as they lead their enterprises to do the same.”
To help CFOs see trends across industries and figure out how they compare with peers, Gartner experts have prepared industry cost curves looking at how finance function spending increases relative to company revenue.
Gartner experts said the spend in software and internet services for the finance function reflects the higher levels of digitalisation in the industry as a whole compared to others.
The pharmaceuticals and life sciences sector is noteworthy, because of how much finance cost scales as a business grows. At the smallest end of the revenue scale, pharmaceutical firms are one of the top spenders on corporate finance, but the highest revenue firms in this sector are spending less on finance than most other industry sectors.
Finance Cost Curve, Multiple Industries, $50M – $10B Revenue
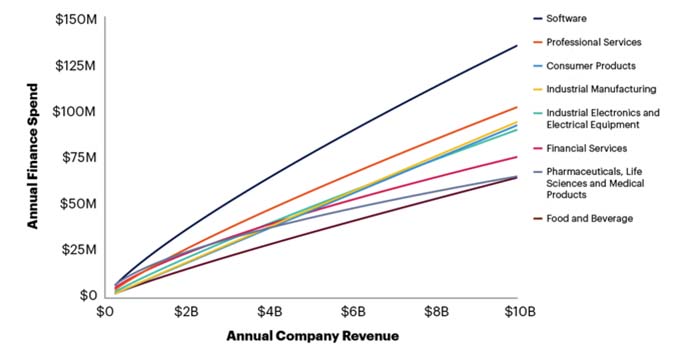
Source: Gartner (August 2022); N = 420
“Spending more or less does not necessarily imply ‘good’ or ‘bad’ levels,” says Williams, “For example, a low spend relative to peers may signal efficiency, but it may also reflect underinvestment. Similarly, high spend may show a need to cut costs, but perhaps it reflects a finance function that has invested into capabilities to serve as a strategic business partner.”
Cost curves
Traditional finance function benchmarks group companies within a wide band of similarly sized peers. Cost Curves allow organizations to pinpoint their expected spend for a specific annual revenue. This allows companies to identify not only how they compare now but how expected spend may change as they grow.
Data for Gartner’s Cost Curves originates from Gartner’s Finance Budget & Efficiency Benchmark. Finance spend includes personnel spend (in-house salaries, benefits, bonus, training and development, and travel and entertainment spend), finance technology spend (software, hardware, people, and external contractors and services), outsourcing, and consultants and professional services spend across eight processes in finance:
- Finance Management and Administration
- Financial Planning and Analysis (FP&A)
- Accounting and Reporting
- Transactional Finance
- Tax
- Treasury
- Investor Relations
- Internal Audit
External audit fees, bank fees, insurance premiums, procurement, real estate and corporate IT expenses are excluded from the finance spend data for all participating companies.