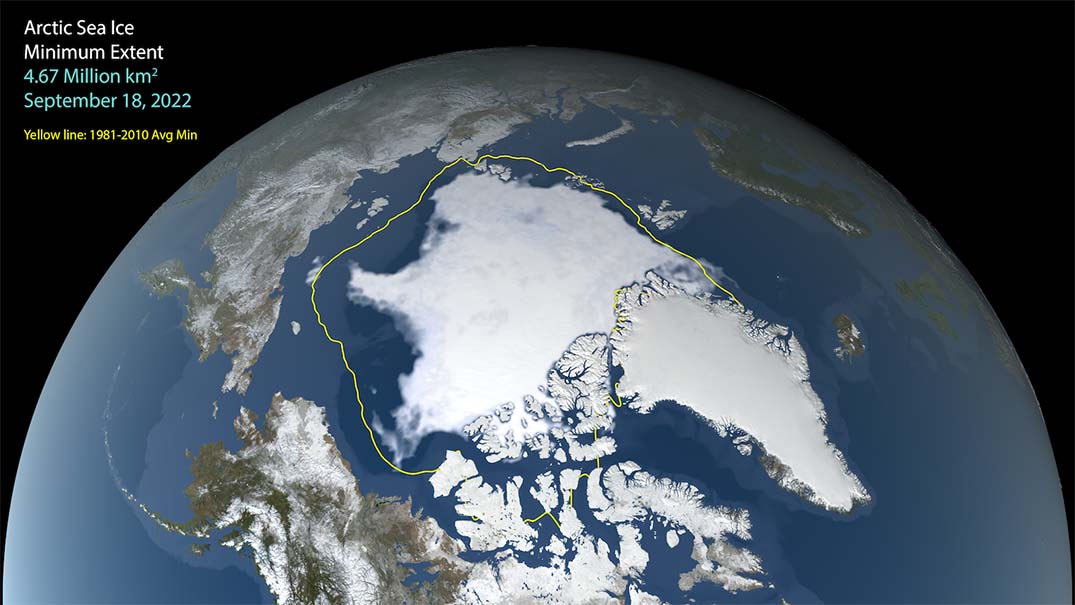
According to satellite observations, Arctic sea ice reached its annual minimum extent on 18 September 2022. The ice cover shrank to an area of 4,67-million square kilometers this year, roughly 1,55-million square kilometers below the 1981-2010 average minimum of 6,22-million square kilometers.
Summer ice extent in and around the Arctic Ocean has declined significantly since satellites began measuring it consistently in 1978. The past 16 years (2007 to 2022) have been the lowest 16 minimum extents, with 2022 tying 2017 and 2018 for 10th-lowest in 44 years of observations.
The satellite record is maintained by the National Snow and Ice Data Centre (NSIDC), which hosts one of NASA’s Distributed Active Archive Centers.
“This year marks a continuation of the much-reduced sea ice cover since the 1980s,” says Walt Meier, a sea ice researcher at the National Snow and Ice Data Centre. “That is not something that is random variations or chance. It represents a fundamental change in the ice cover in response to warming temperatures.”
Each year, Arctic sea ice melts through the warmer spring and summer months and usually reaches its minimum extent in September. As cooler weather and winter darkness sets in, the ice will grow again and reach its maximum extent around March.
Sea ice extent is defined as the total area in which ice concentration is at least 15%. This visualisation, created at NASA’s Goddard Space Flight Centre, shows fluctuations in Arctic sea ice extent from March through September 2022. The map is based on data acquired by the Advanced Microwave Scanning Radiometer 2 (AMSR2) instrument on the Japan Aerospace Exploration Agency’s Global Change Observation Mission 1st-Water “SHIZUKU” (GCOM-W1) satellite.
Featured image: This image visualises sea ice change in the Arctic using data provided by the Japan Aerospace Exploration Agency’s Global Change Observation Mission 1st-Water “SHIZUKU” satellite, which is part of a NASA-led partnership to operate several Earth-observing satellites. The visualisation can be accessed at https://svs.gsfc.nasa.gov/5030.
Credit: NASA’s Scientific Visualisation Studio.