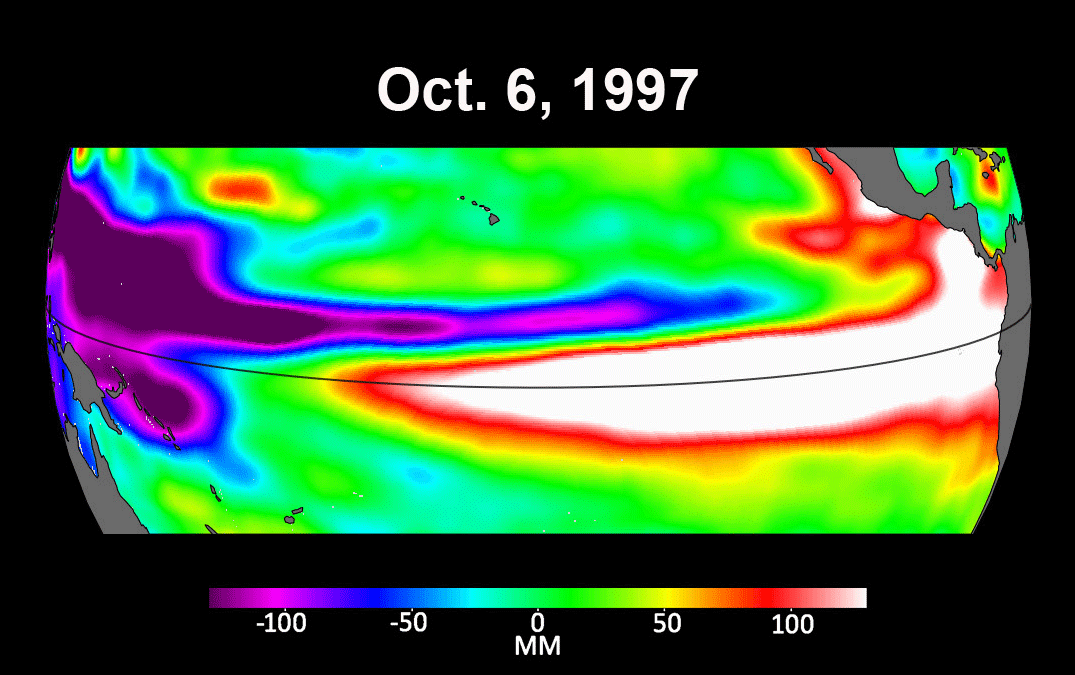
Not all El Niño events are created equal – their impacts vary widely, and satellites like the US-European Sentinel-6 Michael Freilich help anticipate those impacts on a global scale by tracking changes in sea surface height in the Pacific Ocean.
Water expands as it warms, so sea levels tend to be higher in places with warmer water. El Niños are characterised by higher-than-normal sea levels and warmer-than-average ocean temperatures along the equatorial Pacific.
These conditions can then propagate poleward along the western coasts of the Americas. El Niños can bring wetter conditions to the US Southwest and drought to regions in the western Pacific, including Indonesia. This year’s El Niño is still developing, but researchers are looking to the recent past for clues as to how it is shaping up.
There have been two extreme El Niño events in the past 30 years: the first from 1997 to 1998 and the second from 2015 to 2016. Both caused shifts in global air and ocean temperatures, atmospheric wind and rainfall patterns, and sea level.
The maps above show sea levels in the Pacific Ocean during early October 1997, 2015, and 2023 with higher-than-average ocean heights in red and white, and lower-than-average heights in blue and purple. Sentinel-6 Michael Freilich captured the 2023 data, the TOPEX/Poseidon satellite collected data for the 1997 image, and Jason-2 gathered data for the 2015 map.
By October 1997 and 2015, large areas of the central and eastern Pacific had sea levels more than 7 inches (18cm) higher than normal. This year, sea levels are about 2 or 3 inches (5cm to 8cm) higher than average and over a smaller area compared to the 1997 and 2015 events. Both of the past El Niños reached peak strength in late November or early December, so this year’s event may still intensify.
“Every El Niño is a little bit different,” says Josh Willis, Sentinel-6 Michael Freilich project scientist at NASA’s Jet Propulsion Laboratory in Southern California. “This one seems modest compared to the big events.”
Featured picture: The maps above show sea levels in the Pacific Ocean during early October 1997, 2015, and 2023 in the run up to El Niño events. Higher-than-average ocean heights appear red and white, and lower-than-average heights are in blue and purple.
Credit: NASA/JPL-Caltech

