Intel has released its Continuous Profiler to open source.
The optimisation agent is actively used by companies including ironSource, ShareChat and Snap to identify production bottlenecks and optimisation opportunities.
Developed by Intel Granulate and contributed to the open source community, Continuous Profiler is a solution that combines multiple profilers into one view as a flame graph.
This unified view offers developers, performance engineers and DevOps a continuous and autonomous way to identify runtime inefficiencies.
“Continuous Profiler has been at the heart of what we’ve been doing at Intel Granulate. By helping developers identify bottlenecks in the code, businesses can optimise their applications more easily and effectively,” says Asaf Ezra, GM of Intel Granulate.
Determining why central processing units (CPUs) are busy is a routine task for performance analysis in any testing and production environment. Continuous Profiler delivers a flame graph of the hottest code paths.
“This visualised view makes it immediately obvious where CPU is consumed so you can find cost savings, eliminate bottlenecks, improve throughput, and reduce latency and performance regressions,” says Brendan Gregg, Intel Fellow.
“In today’s complex environment, however, flame graphs can unearth so many performance wins that it becomes laborious to apply them all. Intel Granulate automates this task, allowing companies to realize these performance wins now and in the future as Intel develops more optimizations.”
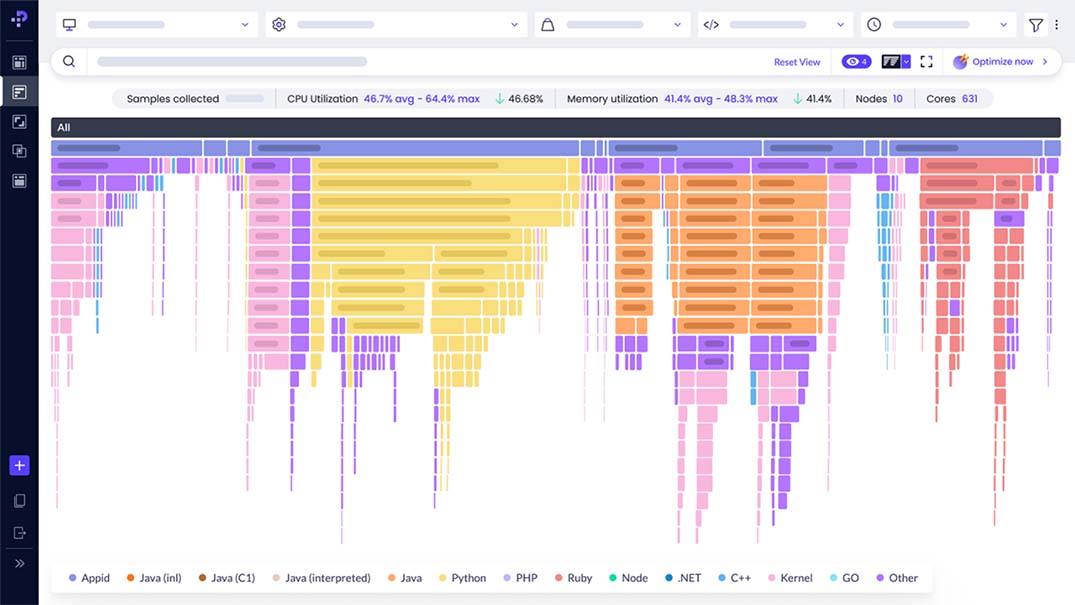
The evolution of gProfiler, Continuous Profiler combines multiple sampling profilers to produce a unified visualization of what a CPU is spending time on. Easy-to-navigate flame graphs pinpoint performance regressions, such as garbage collection, deadlocks and others to help smooth deployments.
Among its unique features, Continuous Profiler allows DevOps to filter services based on container name, hostname or Kubernetes deployment object by simply selecting the resolution level within the platform.
These native Kubernetes filters profile down from the deployment to pod level without having to deploy a profiler for each object. This allows teams to investigate the behavior of different deployments, pods, nodes and hosts across different regions and code.
The profiler is compatible with Intel Granulate’s continuous optimisation services and can be deployed cluster-wide within minutes, supporting a range of programming languages without requiring code changes.
Continuous Profiler is SOC2-certified.