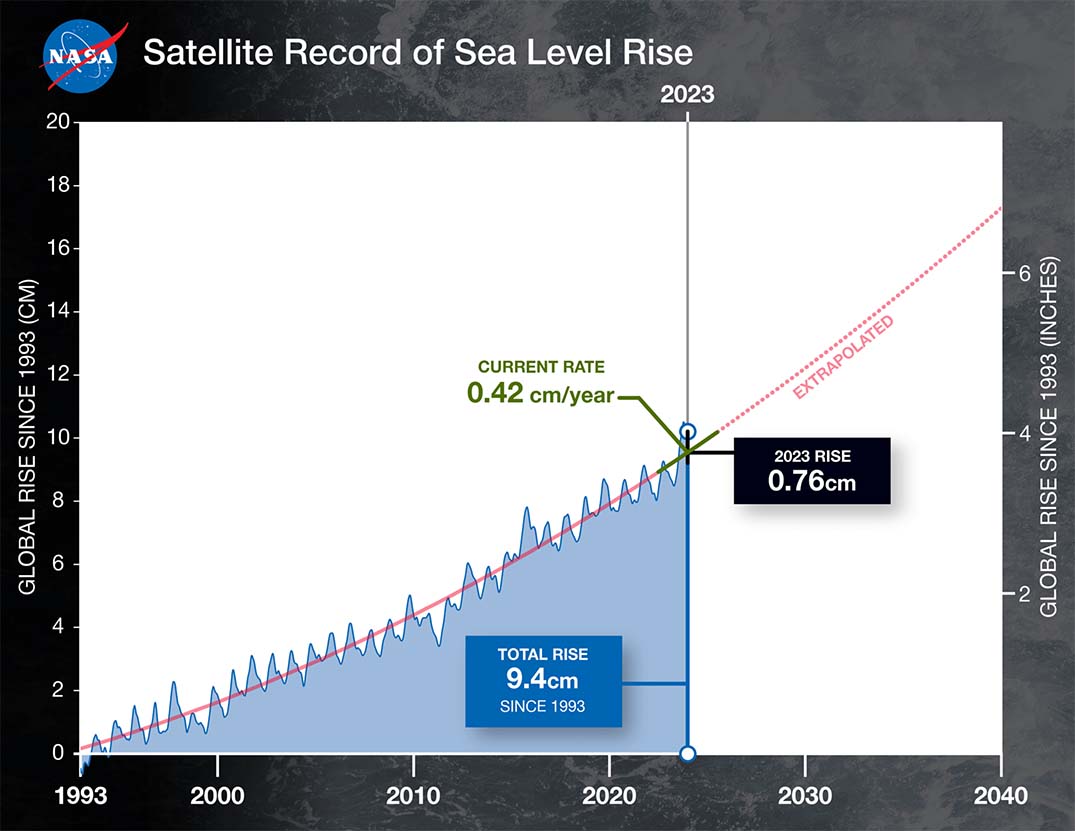
Global average sea level rose by about 0,76cm from 2022 to 2023, a relatively large jump due mostly to a warming climate and the development of a strong El Niño.
This NASA-led analysis is based on a sea level dataset featuring more than 30 years of satellite observations, starting with the US-French TOPEX/Poseidon mission, which launched in 1992. The Sentinel-6 Michael Freilich mission, which launched in November 2020, is the latest in the series of satellites that have contributed to this sea level record.
The data shows that global average sea level has risen a total of about 9,4cm since 1993. The rate of this increase has also accelerated, more than doubling from 0,18cm per year in 1993 to the current rate of 0,42cm per year.

This graph shows global mean sea level (in blue) since 1993 as measured by a series of five satellites. The solid red line indicates the trajectory of this increase, which more than doubled over the past three decades. The dotted red line projects future sea level rise.
Credit: NASA/JPL-Caltech
“Current rates of acceleration mean that we are on track to add another 20cm of global mean sea level by 2050, doubling the amount of change in the next three decades compared to the previous 100 years and increasing the frequency and impacts of floods across the world,” says Nadya Vinogradova Shiffer, director for the NASA sea level change team and the ocean physics program in Washington.
Global sea level saw a significant jump from 2022 to 2023 due mainly to a switch between La Niña and El Niño conditions. A mild La Niña from 2021 to 2022 resulted in a lower-than-expected rise in sea level that year. A strong El Niño developed in 2023, helping to boost the average amount of rise in sea surface height.
La Niña is characterised by cooler-than-normal ocean temperatures in the equatorial Pacific Ocean. El Niño involves warmer-than-average ocean temperatures in the equatorial Pacific. Both periodic climate phenomena affect patterns of rainfall and snowfall as well as sea levels around the world.
“During La Niña, rain that normally falls in the ocean falls on the land instead, temporarily taking water out of the ocean and lowering sea levels,” says Josh Willis, a sea level researcher at NASA’s Jet Propulsion Laboratory in Southern California. “In El Niño years, a lot of the rain that normally falls on land ends up in the ocean, which raises sea levels temporarily.”
This animation shows the rise in global mean sea level from 1993 to 2023 based on data from a series of five international satellites. The spike in sea level from 2022 to 2023 is mostly a consequence of climate change and the development of El Niño conditions in the Pacific Ocean.
Credit: NASA’s Scientific Visualisation Studio
Seasonal or periodic climate phenomena can affect global average sea level from year to year. But the underlying trend for more than three decades has been increasing ocean heights as a direct response to global warming due to the excessive heat trapped by greenhouse gases in Earth’s atmosphere.
“Long-term datasets like this 30-year satellite record allow us to differentiate between short-term effects on sea level, like El Niño, and trends that let us know where sea level is heading,” says Ben Hamlington, lead for NASA’s sea level change team at JPL.
These multidecadal observations wouldn’t be possible without ongoing international co-operation, as well as scientific and technical innovations by NASA and other space agencies. Specifically, radar altimeters have helped produce ever-more precise measurements of sea level around the world.
To calculate ocean height, these instruments bounce microwave signals off the sea surface, recording the time the signal takes to travel from a satellite to Earth and back, as well as the strength of the return signal.
The researchers also periodically cross-check those sea level measurements against data from other sources. These include tide gauges, as well as satellite measurements of factors like atmospheric water vapor and Earth’s gravity field that can affect the accuracy of sea level measurements.
Using that information, the researchers recalibrated the 30-year dataset, resulting in updates to sea levels in some previous years. That includes a sea level rise increase of 0,21cm from 2021 to 2022.
When researchers combine space-based altimetry data of the oceans with more than a century of observations from surface-based sources, such as tide gauges, the information dramatically improves our understanding of how sea surface height is changing on a global scale. When these sea level measurements are combined with other information, including ocean temperature, ice loss, and land motion, scientists can decipher why and how seas are rising.
Featured picture: Sea level rise is affecting coastal communities around the world, especially those like Honolulu, pictured, that are located on islands.
NOAA Teacher at Sea Program, NOAA Ship HI’IALAKAI

