The threat landscape is full of moving targets. Over time, popular tools, tactics, and procedures change: malicious techniques shift to follow global trends, and often disappear or resurface, sometimes years down the line.
To stay ahead of this ebb and flow, security practitioners monitor network traffic and adapt their defences to protect their users and networks. Keeping on top of these trends is one of the most challenging tasks for any security team.
A good way to monitor for trends is in malicious DNS activity. These days almost all malicious activity requires an internet connection to successfully carry out an attack. For example, an attacker uses a backdoor to connect to a remote system and send it instructions. Information stealers need a connection to malicious infrastructure to exfiltrate sensitive data.
Ransomware groups need to be able to “flip the switch” remotely to encrypt the victim’s systems.
In Cisco’s latest report, Cyber Threat Trends Report: From Trojan Takeovers to Ransomware Roulette, the extraordinary volume of malicious domains that require blocking – over 1-million every hour – were examined for malicious trends and patterns. This data is provided by a DNS-layer security that is available in Cisco Umbrella and Cisco Secure Access.
Here is a closer look at how this research was conducted and some of the trends highlighted in the report.
How the DNS data was analysed
To create a clear picture from such a large data set, it is important to analyse the categories Umbrella applies to known malicious domains. These Threat Type categories are functional groupings of threats that use similar techniques in their attacks.
Over an eight-month timeframe (August 2023–March 2024) data was analysed to calculate the monthly average volume for each Threat Type category. To understand the trends, it was necessary to calculate how much each month was above or below the average volume. This provided a simplified look at how threat activity changes over time.
Patterns began to emerge from large batches of malicious internet traffic with interesting results.
The most active threat type categories found in the report were:
Information stealers
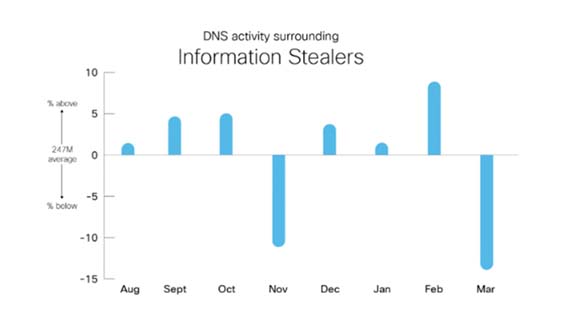
The threat category that saw the most activity during the time frame was information stealers. As a category that includes exfiltrating large batches of documents and monitoring audio/video communications to generate a large amount of DNS traffic, this outcome was not unexpected.

A definite trend can be seen — three months of above-average activity, followed by one month of below-average activity. These drops in activity could be tied to attack groups processing the data they steal. When extensive documents and recordings to sift through, it makes sense that attack groups would need time to process the data.
Trojans versus ransomware
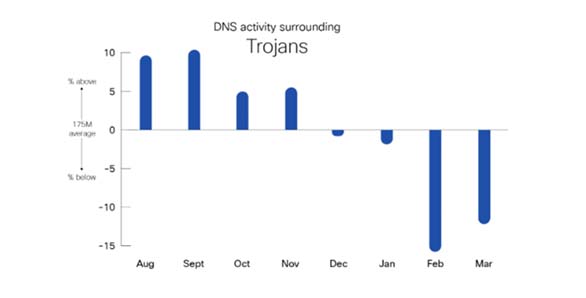
Iin a comparison of Trojans and ransomware, Trojan activity was highest in the beginning of the time frame, then declined over time. This activity doesn’t indicate that the use of Trojans is losing traction but rather highlights the ebb-and-flow nature that is regularly seen in the threat landscape. When Trojan activity declines, other threat types often increase.

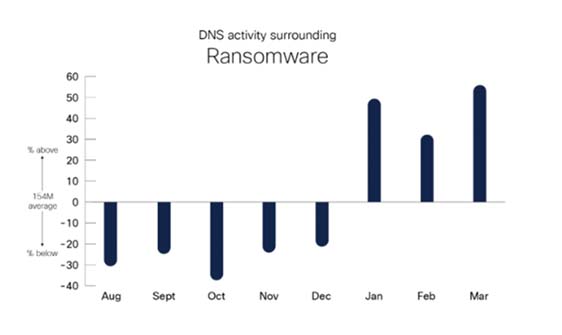
In contrast to Trojan activity, ransomware activity appears to be trending in the other direction. The first few months of the time frame saw below average activity, but then in January it spiked well above average and stayed that way.

Why are these two differing threat types be trending in opposite directions? In many cases threat actors will utilise Trojans to infiltrate and take over a network, and then once they’ve gained sufficient control, deploy ransomware.

